Arcus Education provides “Skills Series” for the entire CHOP community.
This Skills Series is a short, 2-session series aimed at Demystifying R and RStudio!
Session 1: Introduction to R/RStudio
Session 2: Introduction to Literate Statistical Programming
Session 2 Itinerary
Literate Statistical Programmi
Review of R and RStudio
Literate programming is a programming paradigm
Research reproducibility reminders
Quarto documents
Next steps
Goals:
Describe what makes programming “literate”
Explain the real-life consequence of irreproducible research
Name one way Quarto documents can be helpful in data analysis
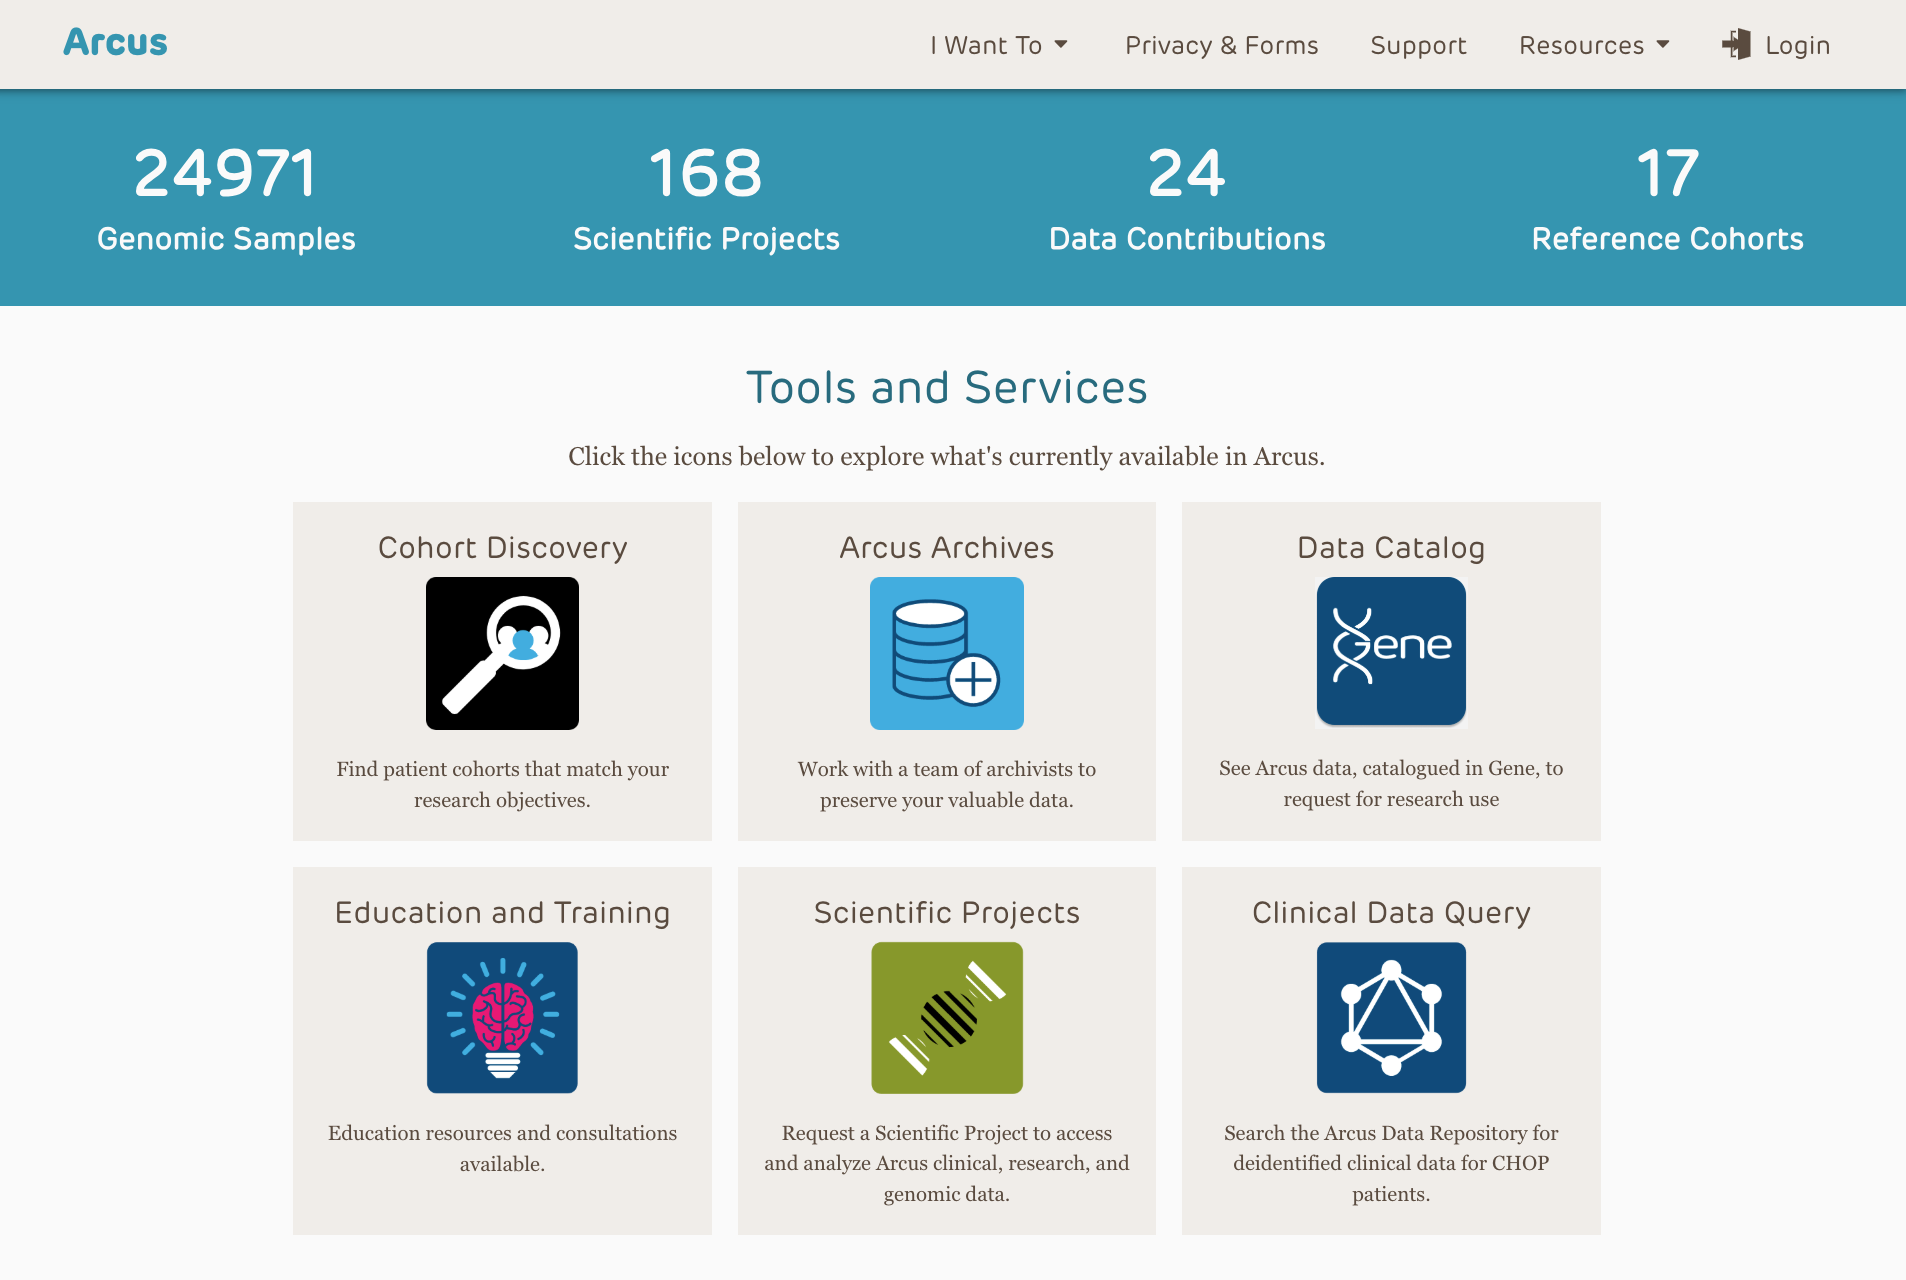
R Vs RStudio
R Programming language for data analysis
RStudio Integrated development environment (IDE)
Literate Statistical Programming
Literate programming – Donald Knuth’s term for programming that is effective not just for computers but for people.
Statistical programming – when you analyze data statistically, using a programming language.
Literate statistical programming – when you create scripts (for example in R) that describe for the computer and for human readers the analysis you’re doing and why and how you’re doing each step.
A Simple Example
We describe what we do and use headers, bullet points, and other formatting to make it easier for humans to make sense of the code.
The Duke Cancer Scandal
Chemo sensitivity from microarrays
Serious errors in data analysis
Clinical trials based on flawed models
Papers retracted, lawsuits settled
An Easy Mistake
Duke
"1881_at"

"31321_at"

"31725_s_at"

"32307_r_at"
MD Anderson
"1882_g_at"

"31322_at"

"31726_at"

"32308_r_at"
Do you see the off-by-one indexing error?
Easy to make mistakes…
Off-by-one indexing error
Sensitive / resistant label reversal
Confounding in experimental design
Inclusion of data from non-reported sources
Wrong figure shown
… add up to huge patient consequences!
Are You a “Team of One” ?
Can I redo the analysis with this month’s data?
Why do the data in Table 1 not seem to agree with Figure 2?
Why did I decide to omit these six samples from my analysis?
Your closest collaborator is you from 6 months ago…
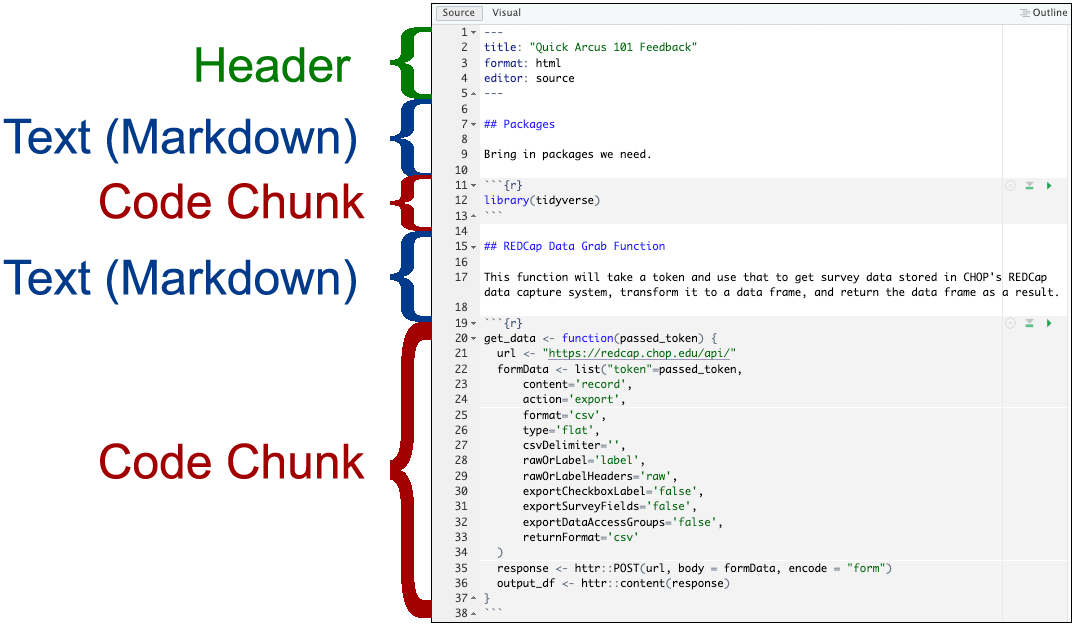
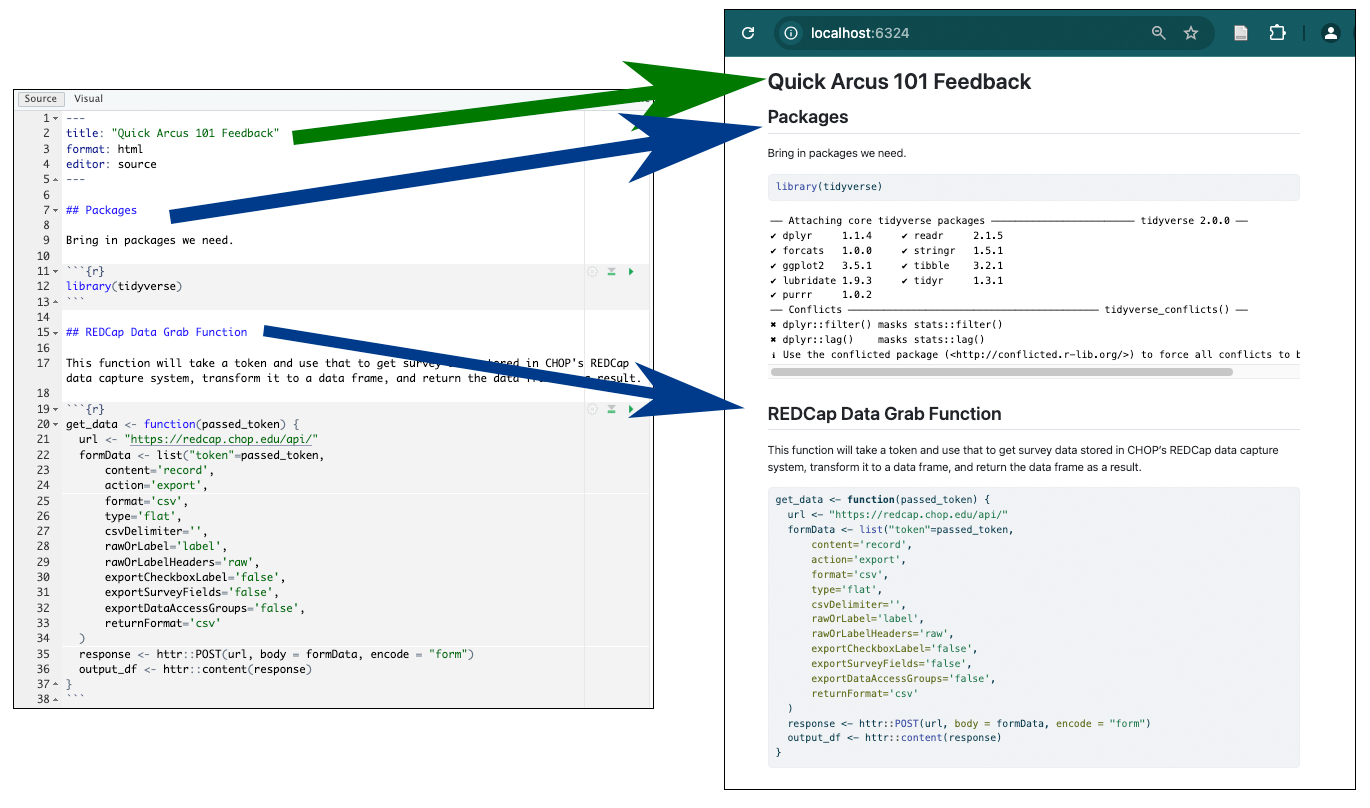
Introducing Quarto
Output Formats
Quarto allows you create documents that interlace:
Your reasoning about your code
The code you write
The output of the code you write
Which helps future-you AND your colleagues!
Ready to Try?
Get access to R and RStudio!
Posit.cloud (just for learning, NOT for working in CHOP data)
Ask to get R and RStudio installed (and consider Git and GitHub, too!)
Learn a little basic R
We suggest learning “tidyverse” and working with data frames first
We very strongly suggest learning within the context of RStudio
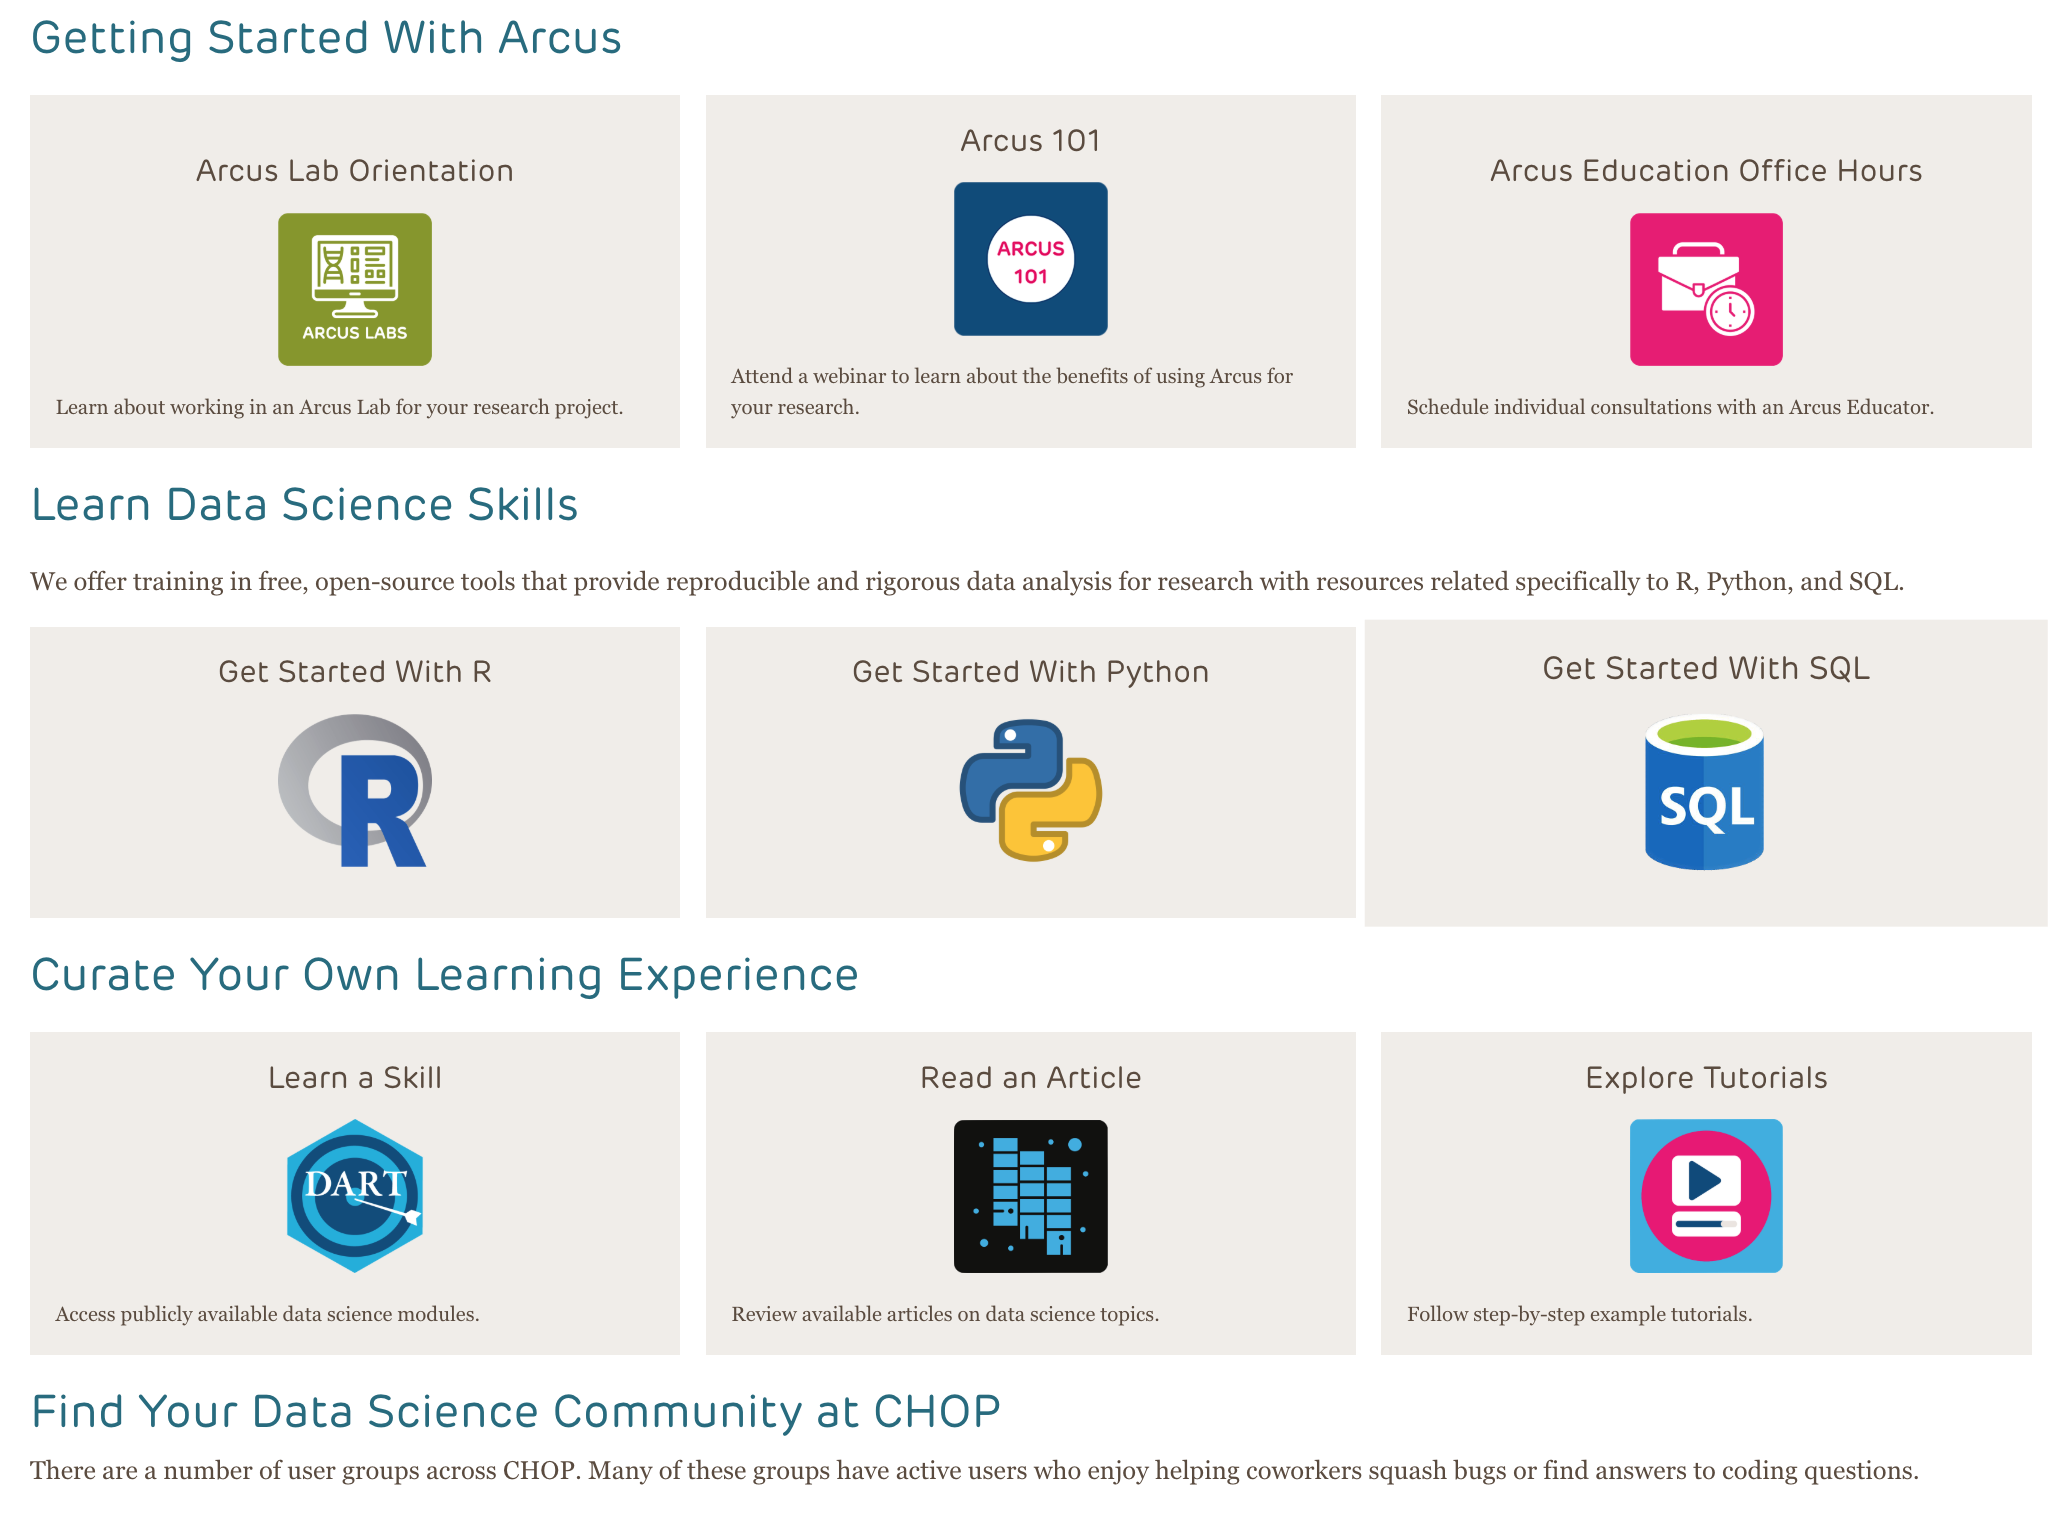
Arcus has some resources (live/synchronous and asynchronous)
So do lots of other people! Consider how you like to learn.
Join CHOP’s R User Group
Pick one task you do manually and try to re-do it in R